Cleveland Wards 2026
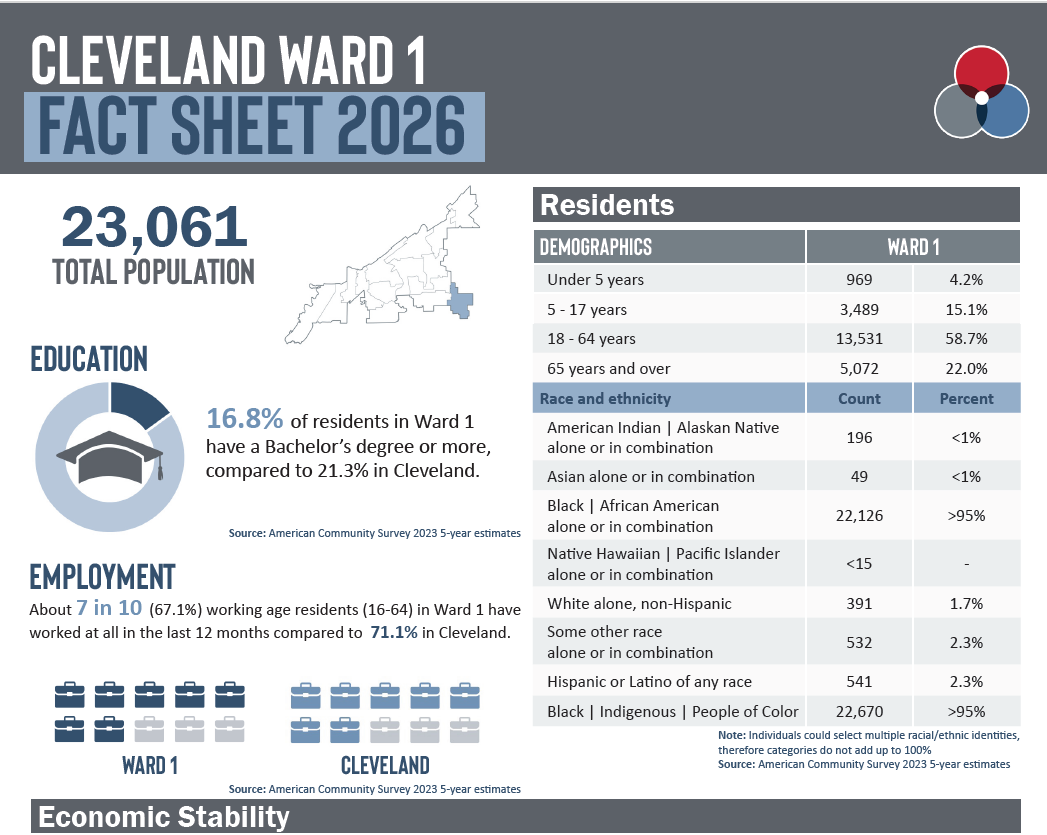
Cleveland Ward fact sheets and data profiles highlight demographic, health, and social indicators in the new 15 wards in Cleveland. The fact sheets summarize and the data profiles provide extensive information about each ward on employment and income, poverty, education, housing and health. This is the first analysis available for Cleveland's revised wards, now 15 from the prior 17. Data released 2025.

Share these fact sheets
Source Document
Datafile
Methodology
Interact with the data using this worksheet.
Some data came from the 2025 Cleveland Health Survey, which represents a collaboration between the Prevention Research Center for Healthy Neighborhoods at Case Western Reserve University (CWRU) and the Cleveland Department of Public Health (CDPH). This report represents the views of the authors and does not necessarily represent the official position of the funding organizations, CWRU or CDPH.
Explore Topics
Browse articles, research reports, and testimony.
Explore more fact sheets

Federal Congressional Districts in Ohio
These fact sheets explore demographics, economic stability, food security, housing, education and employment, health, and funding sources in each of Ohio's 15 Federal Congressional Districts. Data from 2025. Check out the interactive worksheet.

Medicaid in Ohio by County
More than 25 percent of Ohio's population receives health care coverage from Medicaid. These fact sheets explore those covered populations, work requirements, and the potential for coverage loss if policy or funding changes are made to the program. Data released 2025.

Geauga County Municipalities
These fact sheets and data profiles highlight demographic, health, and social indicators in the cities, townships, and villages of Geauga County. The fact sheets summarize and the data profiles provide extensive information about each Municipality on employment and income, poverty, education, housing, and health. Data released in 2024.

.png)
